JstVision
Conceiving, prototyping, and shipping a synchronized full-stack investigation workspace.
JstVision is JstVerify's flagship investigative workspace. It puts session replay, frontend activity, network traffic, and backend distributed trace trees on one synchronized timeline. I spotted the underlying user problem, designed and coded the first working prototype on my own initiative, and led the feature from validation through its implementation.
0 to 1 Feature Work · Telemetry Synchronization · Trace Visualization · Session Replay · Context-Aware Navigation · Product Engineering
Root-Cause Analysis Meant Rebuilding the Timeline by Hand
Finding a root cause in a distributed system means cross-referencing frontend interactions, DOM state, API requests and responses, and database queries. When each of those lives in a separate tool, engineers reconstruct the timeline of a failure manually, switching contexts and re-searching for matching correlation IDs at every step.
That manual reconstruction makes investigations slow and error-prone. The raw signals already existed in our ingestion pipelines. What was missing was the bridge between what the user experienced in the browser and how the services behind it responded.
Naming the Visibility Gap
I coined the term to describe the time and engineering velocity lost while diagnostic data sits in separate tools. Engineers burn real time on every incident correlating session IDs across logs, traces, and replay tools. Context that should follow them has to be rebuilt again and again.
The framing became central to our pitch. It repositioned JstVerify from another dashboard into an investigation platform that preserves context across the whole debugging lifecycle.
From a Side Prototype to the Flagship Feature
While refactoring our application routing, I realized that if context like the active session and trace parameters could travel with the user across views, the same context could drive a synchronized, multi-layer timeline. I started thinking of it as diagnostic imaging for distributed software, one picture assembled from many scans.
The idea was not on the roadmap, so I built it on my own time first. I designed, coded, and wired up a working end-to-end prototype, opened the pull request as ‘Introducing JstVision,’ and demoed the live timeline at our next team meeting. It was adopted as the flagship feature, and it changed how we talked about the platform, from a dashboard analytics tool to an integrated investigation hub.
Synchronizing Multi-Layered Telemetry Streams on a Single Playhead
The workspace puts session playback and the chronological event timeline side by side. As a developer scrubs through frontend interactions, the trace-building code I wrote for the client takes the flat array of incoming distributed trace spans, groups them into a hierarchy by span and parent-span ID, and computes each service's execution offsets in real time.
That synchronization surfaces the matching backend behavior immediately, including trace metadata, execution durations, source code paths, and database query metrics. Because the investigation context follows the developer from page to page, there is no re-searching and no re-building of trace views, just a direct path from frontend symptom to backend cause.
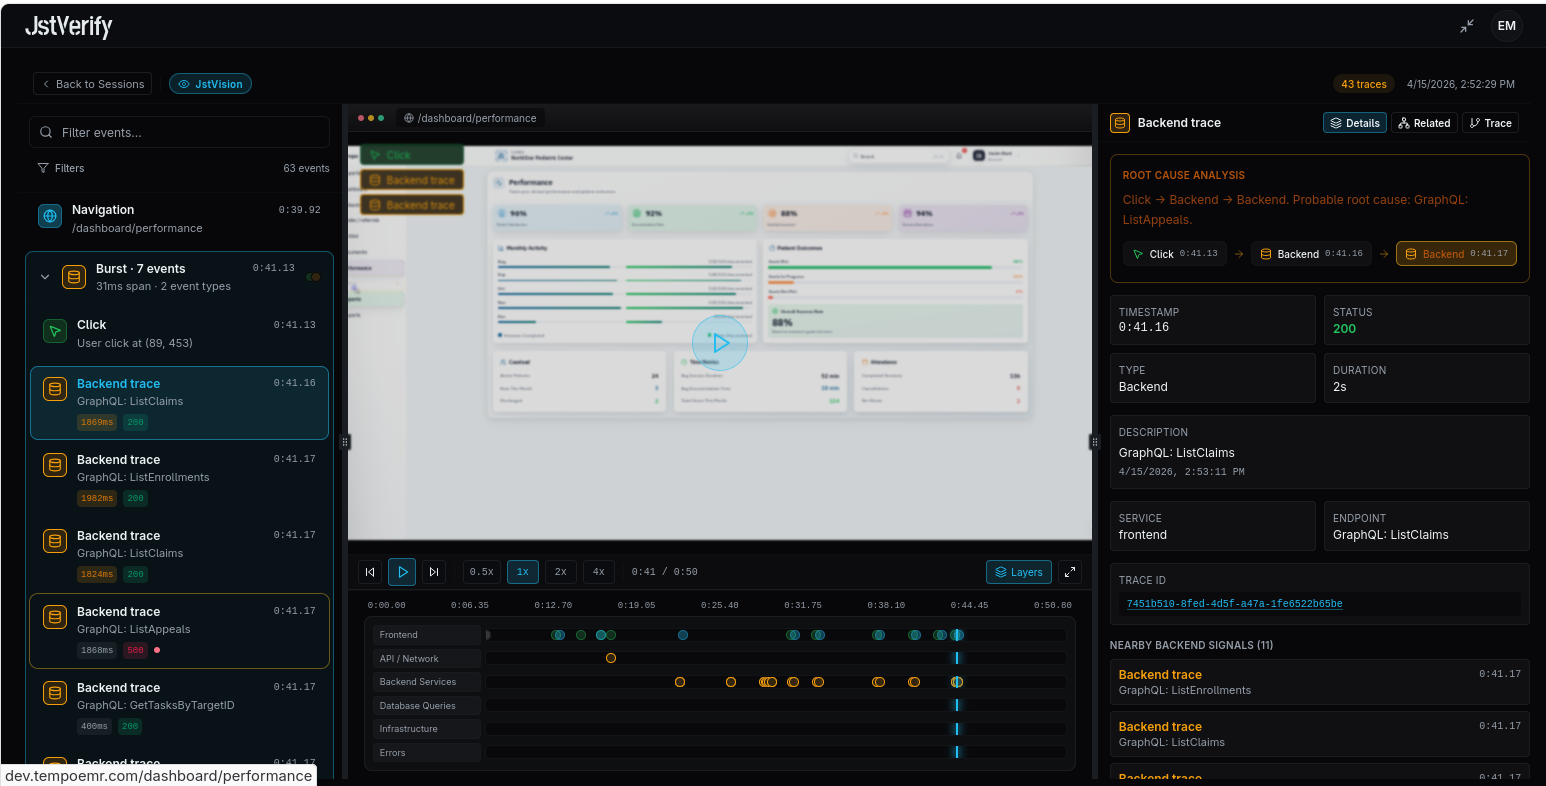
Session replay, the event timeline, and the backend trace with a root-cause hint, all on one screen.
Context That Follows the Investigation
The design pattern underneath JstVision is context-aware navigation. The active session, error parameters, and trace state move with the user across every view, so the repetitive select-and-search cycles that normally stall a debugging session simply do not happen.
It is a pattern I keep returning to. It mirrors the patient-scoped workspaces I built for Tempo EMR. Different domains, same conviction that software should carry context for the person using it.
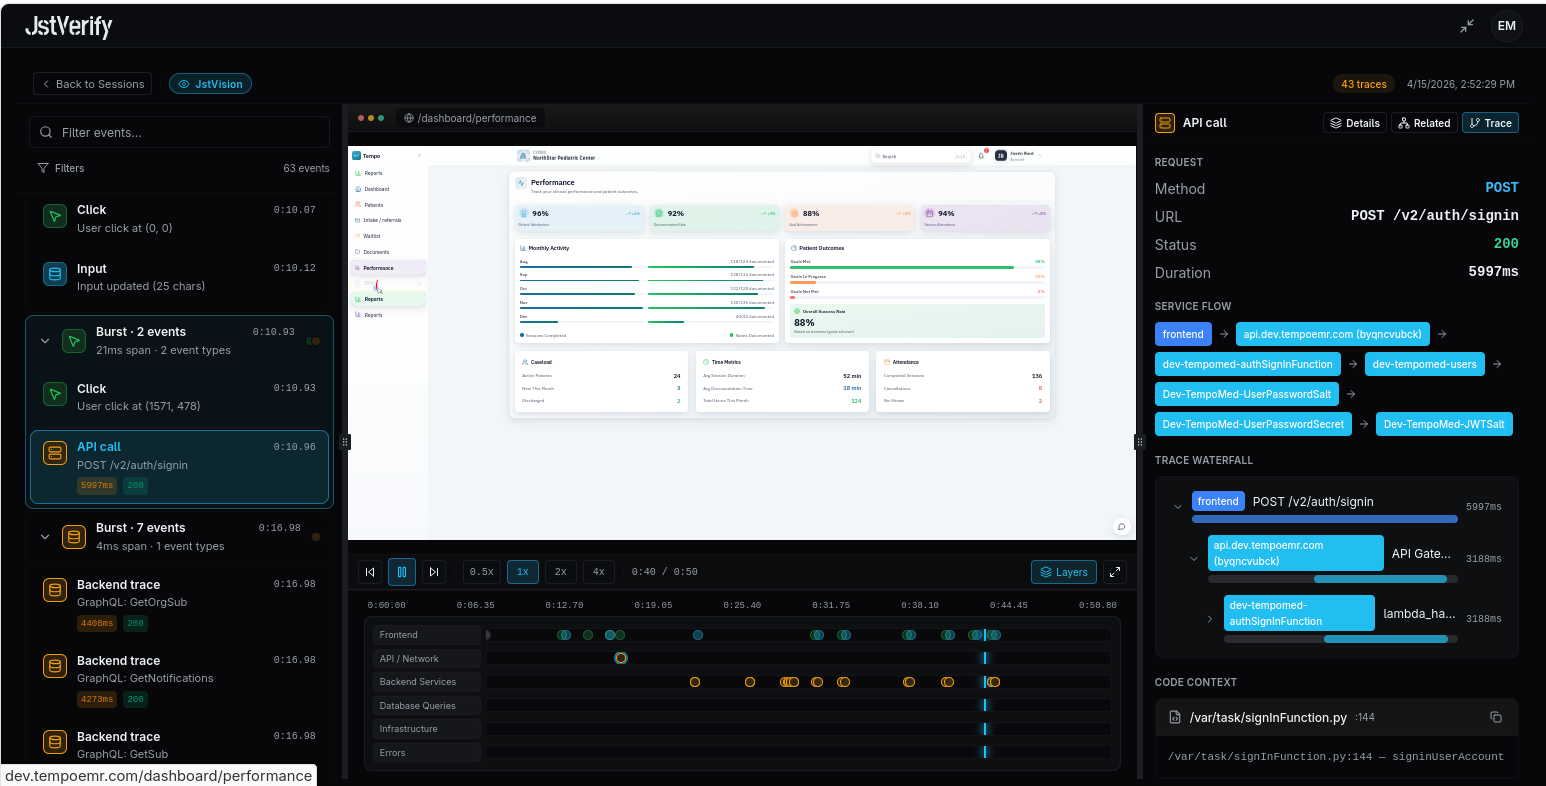
Following a slow sign-in call from the replay, through the service flow, to the Lambda source file behind it.
Where I Led and Where Others Took Over
I conceived JstVision, designed it, and built the initial prototype and timeline interfaces myself. Once the core synchronization was validated, other engineers picked up ingestion correlation, trace-linking performance, and playback optimization, and the founder directed the underlying trace data structures. That handoff is what turning a prototype into a product is supposed to look like.
Next case study
Tempo EMR