JstVerify
Building the product experience for a beta-stage developer observability platform that connects sessions, traces, errors, and service context.
JstVerify is a beta-stage platform that brings session replay, distributed traces, automatically discovered service maps, and error tracking into one debugging environment. As the primary engineer on the product application, I built the app shell, investigation workflows, topology views, and AI analysis surfaces, and shipped several features across the full stack, from Python Lambda backends to the interfaces on top.
Observability Platforms · Distributed Telemetry · Investigation Workflows · Service Context · AI-Assisted Analysis · Product Engineering
Debugging Evidence Lives in Too Many Tools
When production misbehaves, the evidence is scattered. The user's experience is in a session replay tool, the API activity is in network logs, and the backend story is in a tracing system. Engineers reconstruct what happened by copying identifiers between tools and hoping the timestamps line up.
I named this problem the visibility gap, and it became the core of our positioning. It describes the time, velocity, and trust lost while diagnostic data stays disconnected. The engineering goal that followed was a platform that correlates those signals automatically and preserves context through the whole investigation.
Serverless Ingestion, With the Product Built on Top
JstVerify runs on serverless AWS, with an AppSync GraphQL API over Python Lambda ingestion workers and DynamoDB. Telemetry SDKs capture DOM mutations on the frontend and distributed traces on the backend.
The founder built the ingestion pipelines, and I built the product on top of them, which meant working at the seams where session events, API logs, and asynchronous trace spans meet. Much of the hard work was keeping session playback aligned with trace data in real time without dragging down browser performance. I also worked below the product layer where features needed it, writing and fixing Lambda code for feedback handling and functional testing, and wiring new resolvers into the serverless application.
React · TypeScript · Vite · AppSync (GraphQL) · Python Lambda · DynamoDB · Session replay · Distributed tracing
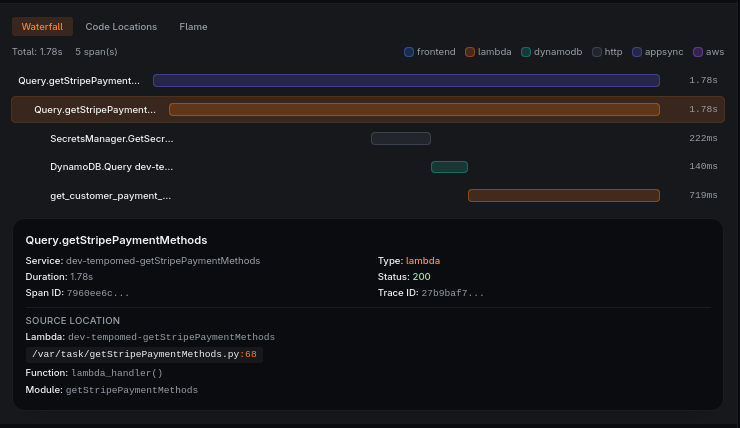
A trace waterfall with per-span timing and the exact source location behind the selected span.
Investigation Dashboards and Service Context Views
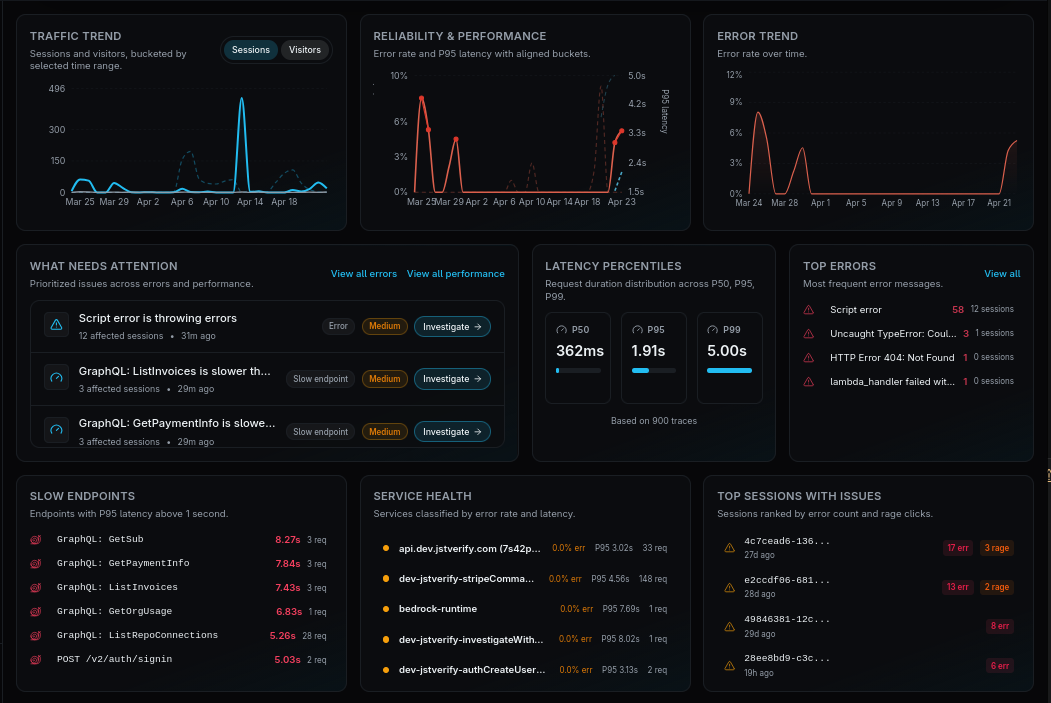
Traffic, reliability, latency percentiles, error trends, and the sessions most worth a look, together on one screen.
The main dashboard is where triage starts. It brings traffic, reliability, latency percentiles (p50/p95/p99), and prioritized error queues into one interactive view. I designed and built these views, the navigation underneath them, and the real-time error filtering, and I reworked the session health scoring that decides which sessions deserve attention first.
From there, developers move into an auto-discovered service map. I built it as a four-tier graph covering the entry point, API layer, compute, and data stores, with request counts and per-service latency on every edge, so slow or failing paths stand out at a glance without losing the thread of the investigation.
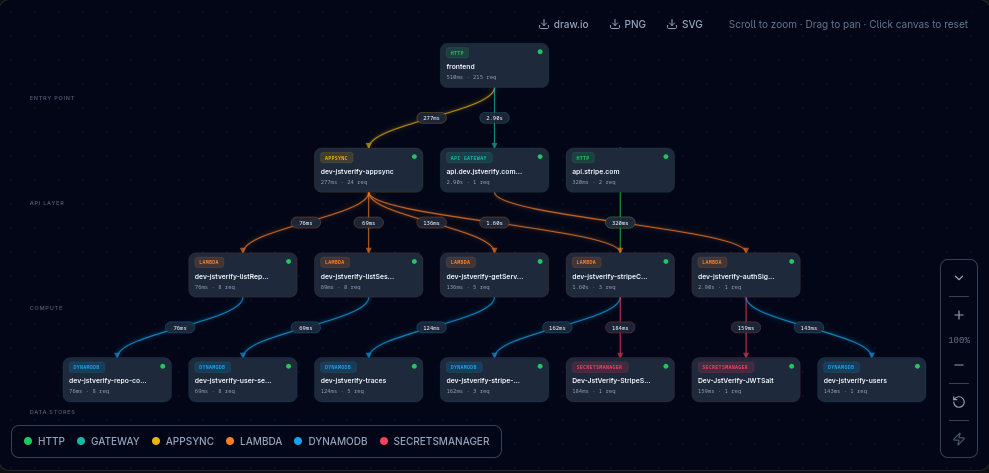
The topology is discovered automatically, with request counts and latency on every edge.
JstVision, a New Investigation Workflow
The deepest technical surface of the platform is JstVision, an investigation workspace that puts session replay, frontend events, and backend traces on a single synchronized timeline. It began as a prototype I designed, built, and demoed on my own initiative, before it was adopted as the flagship feature.
WILMA, AI Analysis With Real Trace Context
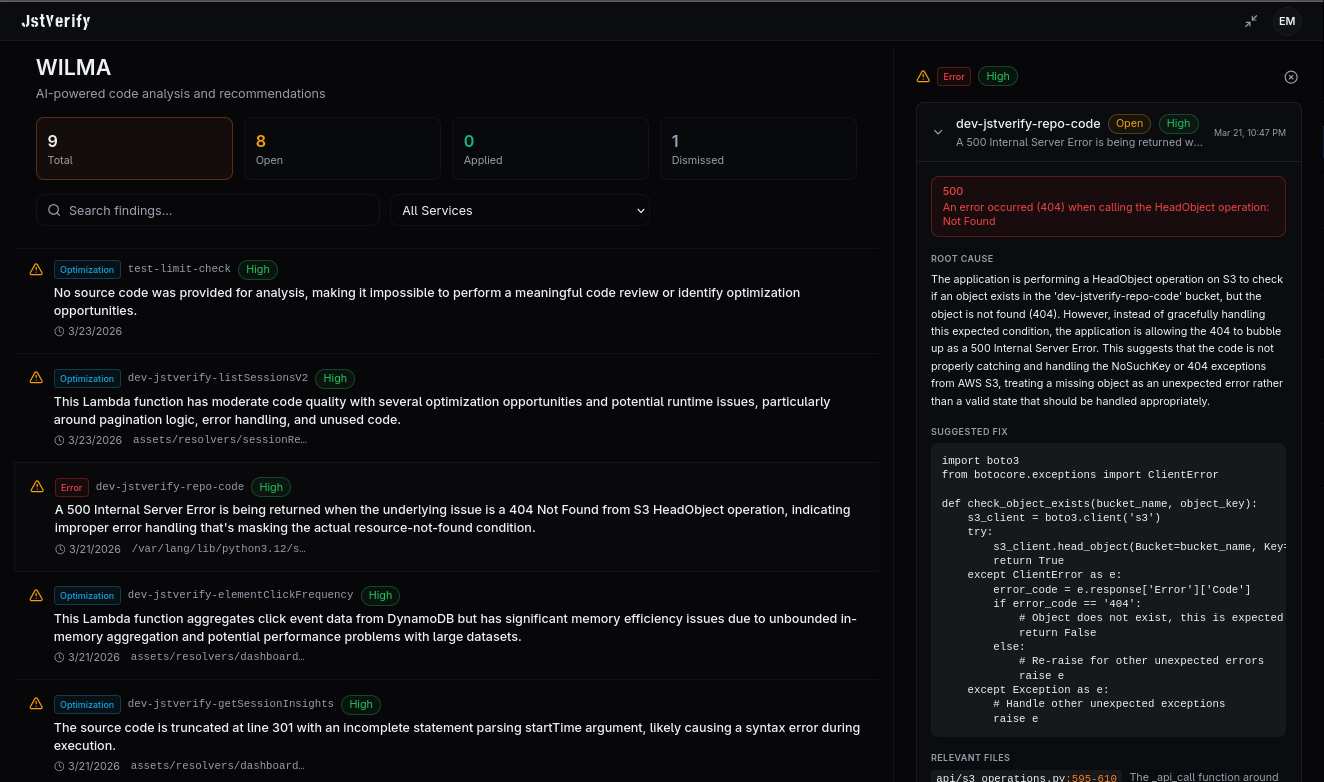
WILMA is the platform's AI-assisted trace analysis feature. When an error occurs, the system gathers the connected traces, code paths, and state context and generates a debugging analysis a developer can actually act on.
The founder built the model backend. I built the developer-facing side, including how trace context gets assembled for the model and the master-detail panels that present findings next to suggested code fixes, with human apply and dismiss review before any recommendation is acted on. I reused the same context-gathering approach to turn raw AWS security findings into plain-language remediation notes.
How the Work Was Split
On a small engineering team, the founder owned telemetry ingestion, trace processing, and the LLM backend, and I owned the product application, including JstVision, the topology interface, the app shell, and theming. Some features I carried across the whole stack myself, like the structured beta feedback system, which runs from a Python Lambda backend through AppSync to a multi-step review UI. I also wrote the public product website and the positioning it is built around.
Next case study
Legacy EMR Migration